Appearance
Fabric Topology
An automatically drawn graph of the network: one node per cabled device, one line per pair of devices that have cables between them. It is read-only — use it to check the design, not to change it.
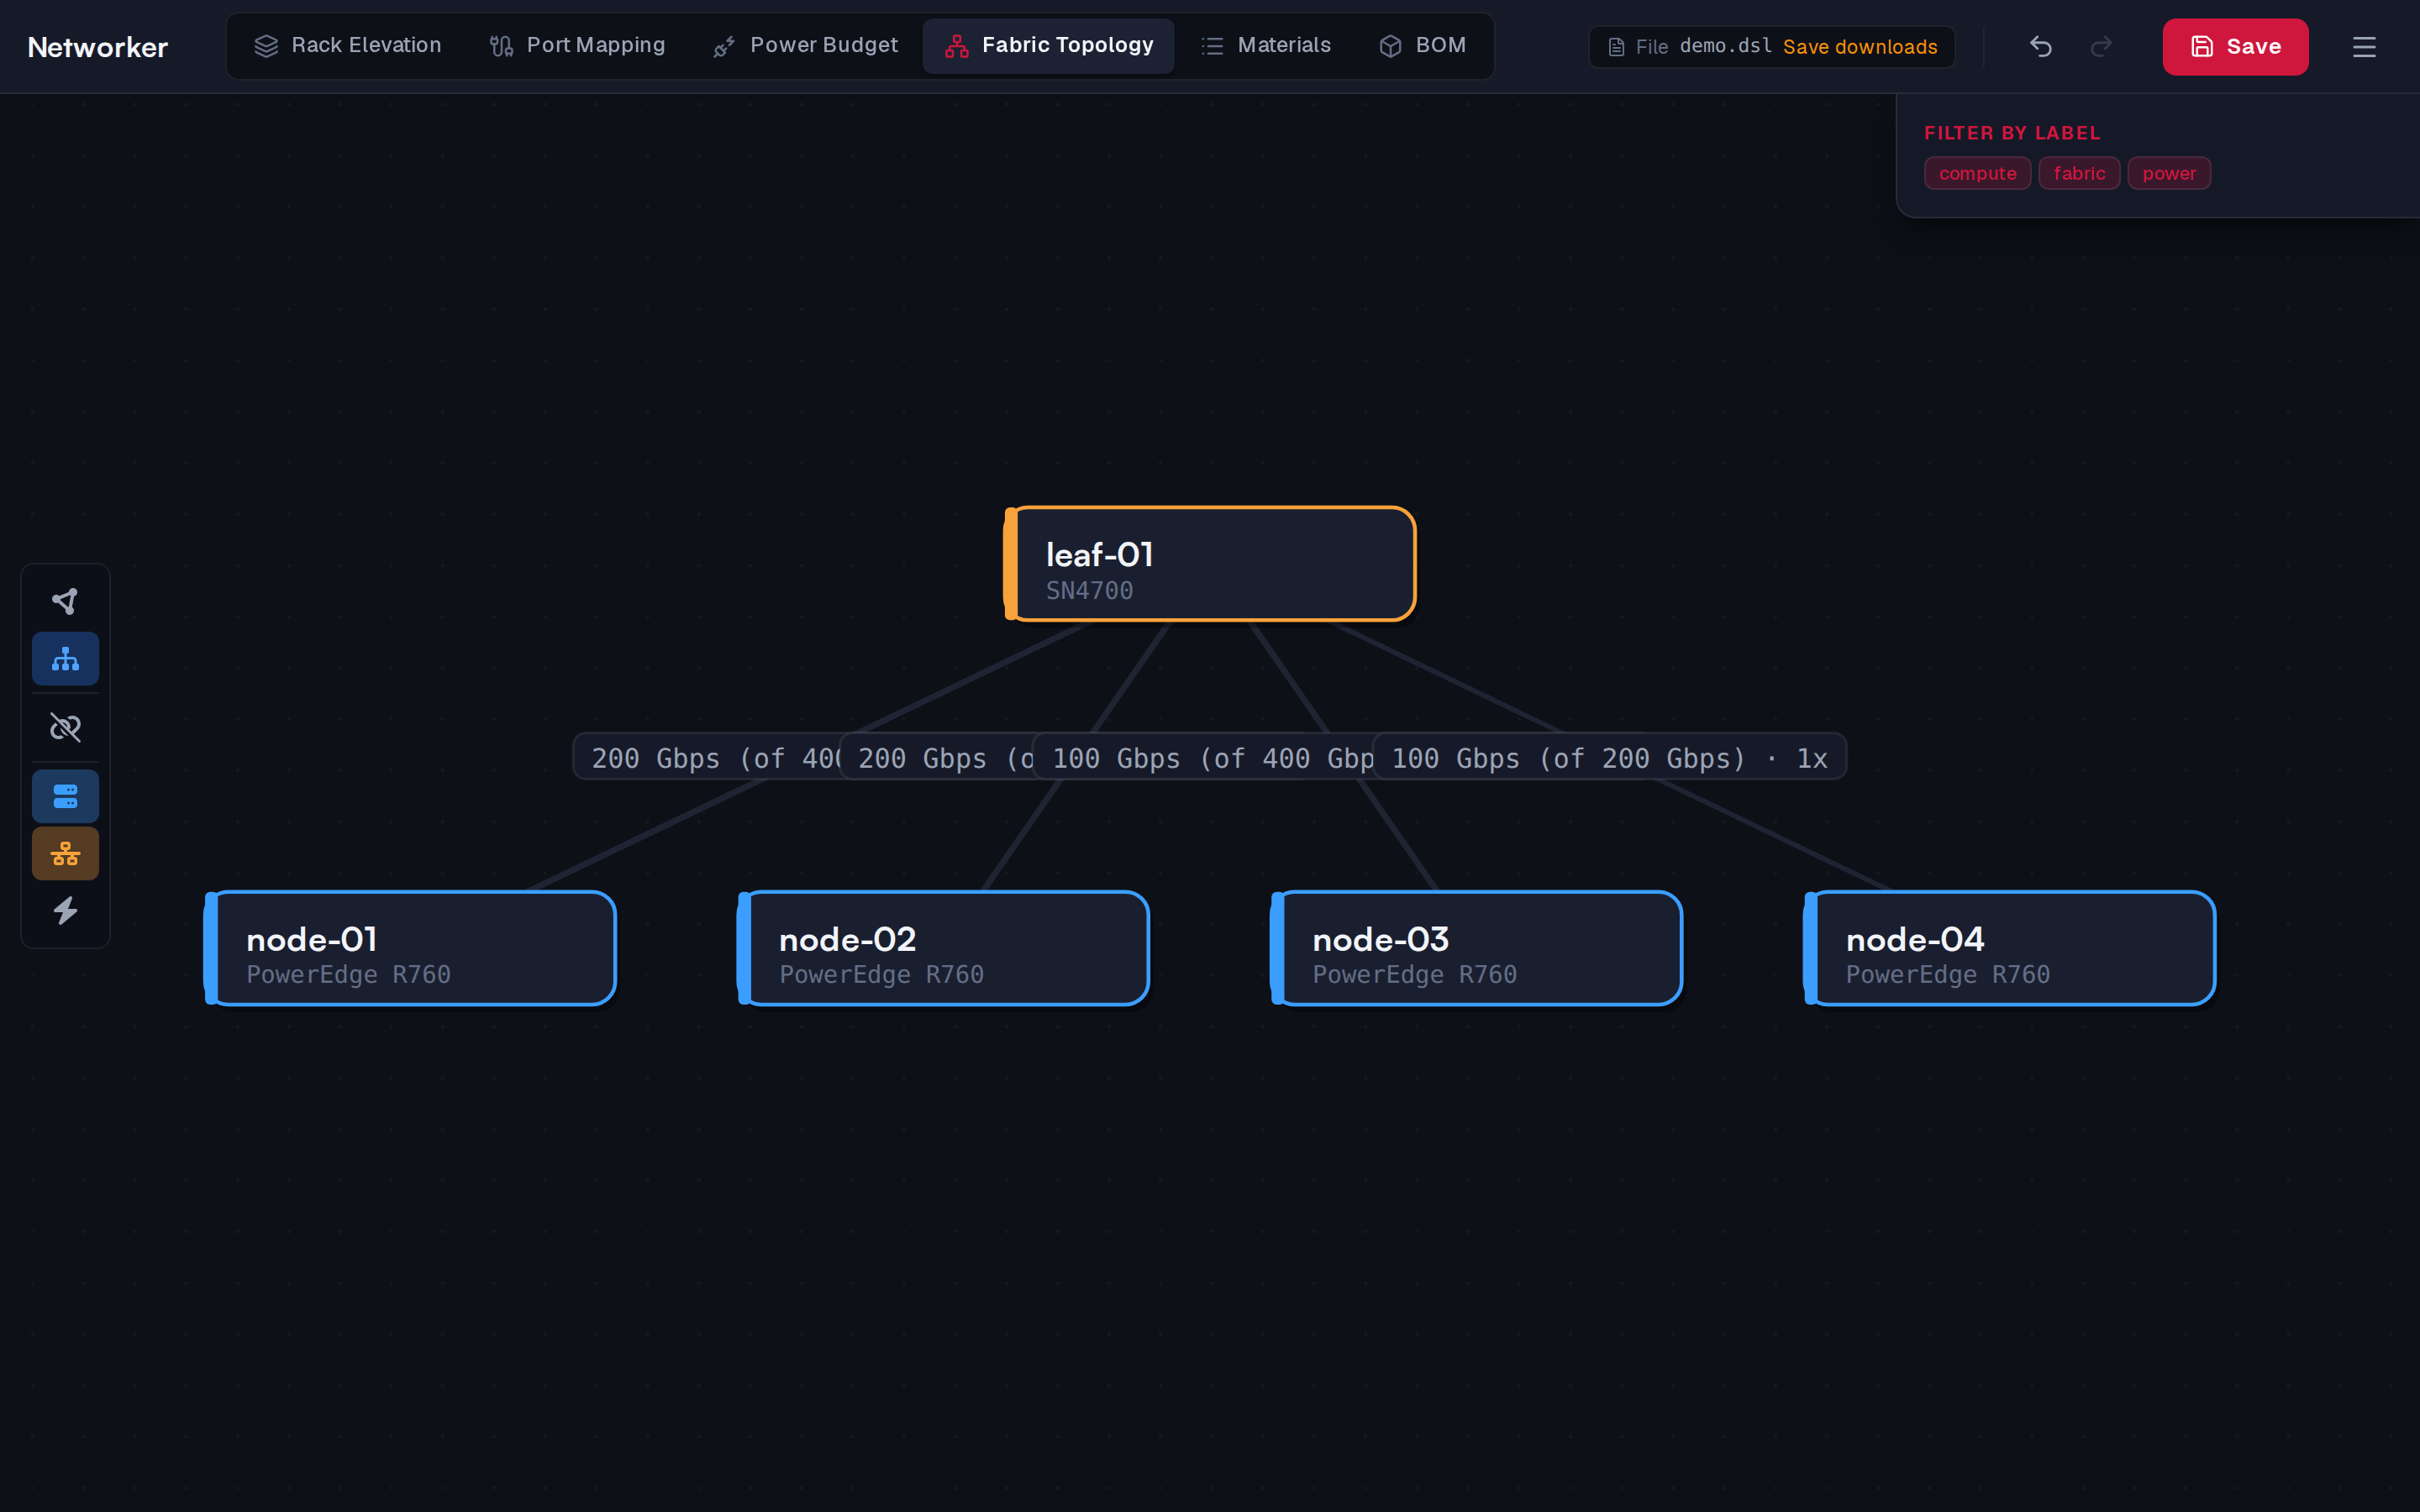
Reading the graph
- Only devices with at least one cable are drawn. A note says how many are left out.
- All the links between two devices are combined into one line, labelled with their total speed and count, for example 1.6 Tbps · 4x. When the links run below their capacity the capacity is shown too (400 Gbps (of 800 Gbps) · 2x), and down links are counted (· 1 down). A down link adds nothing to the total.
- Links that are all down are labelled down, and drawn dashed and grey.
Controls
The toolbar on the left:
| Button | Effect |
|---|---|
| Hierarchy Layout / Star Layout | How the nodes are arranged. Hierarchy is the default |
| Hide / Show down links | Leave out links whose state is down |
| Hide / Show Server, Switch, PDU | Leave out a kind of device |
Dragging a node moves it on screen only; positions are not saved and reset when the graph changes.
Showing only part of the fabric
- Selection — select devices in Port Mapping or Rack Elevation, then open Fabric Topology: it shows only those devices and what they connect to. Show all goes back to everything.
- Labels — the label filter hides devices left out, and its Fabric labels group filters network cables by their labels. See Filtering by label.